Computational Analysis of Text
Disclaimer: the analysis represented on this page fluctuates as additional articles are added to the pool of data used in the creation of the graphs/networks.
One of the first questions we posed after reading the series was: what gender did Nelson incorporate the most dialogue from throughout the series? Nelson's obvious focus in writing the articles is the "City Slave Girl"; so, did Nelson choose to expose the plight of working-class women by giving them a direct voice? The first time we ran the code over just a few beginning articles we found that the female voice was significantly more represented than the male voice. However, as transcriptions of articles from later in the series have been added we start to see a more even distribution of dialogue. We expect once all of the articles are transcribed and incorporated into the data that the female voice will prevail. However, even in the current state, with the male and female percentage of spoken text being almost equal, we can see that Nelson's series and approach in writing these articles provided a significant voice to people in the 19th century who otherwise were marginalized by the patriarchal society: women!
Next, we wanted to see how the dialogue was distributed among the different types of people represented in the series. Nelson spoke with many different groups of people in her exposé for which we created an archetype identifier for each categorization. Thus far, we have found that the working girl has the greatest amount of dialogue. This corresponds with our theory that Nelson provided a genuine voice for the main subjects of her series by giving the "City Slave Girls" the most time to speak. Interestingly, even when compared with Nelson's own dialogue, the working girl is represented twice as much as the author.
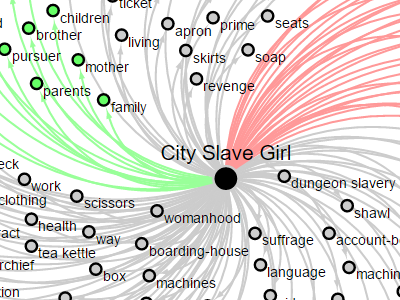
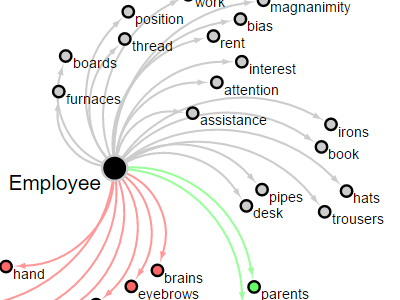
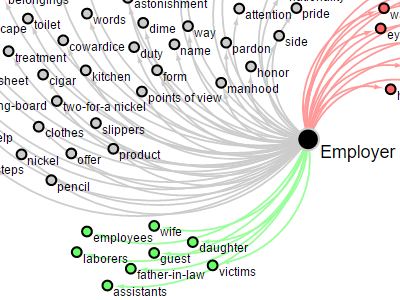
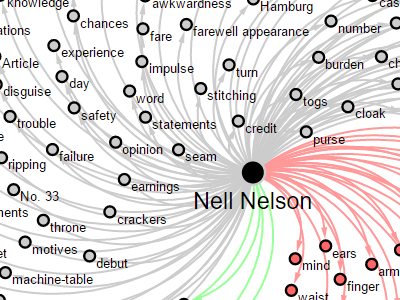
Once we had an idea of how the dialogue was distributed, we then wanted to see how the different groups of people in the text took ownership of not only the material things around them, but also other people in their lives. We hypothesized that the employer would frequently take ownership of those in his employ; however, the network analyses indicate even more interesting relationships of ownership than what was expected. We have created numerous network analyses: one for every article individually as well as one including all of the articles and one for each of the unique project archetypes. We've selected these four archetype networks that highlight interesting ownership relations, but all of the network graphs are available on our GitHub. Select a network graph, on the right, to enlarge.